C2 Obese
Share this link or keep it for future reference. https://www.fitmatic.com/body/calculator/results?id=ef3ca6c2-b1ed-480b-887c-1d0ee03e8e24 Copy to ClipboardNew Snapshot
Age
35 Years
Height
6' 0"
Weight
217.0 lbs
Body Fat %
25.37%
Navy Hodgdon
Navy Hodgdon
Health Indicators
To determine the current state of your body, Doctors and health industry professionals can refer to three indicators that describe your level of obesity. At Fitmatic, we are taking the same approach, but adding better tools and visualizations to allow you to measure your progress and keep you tied to goals.
Body Mass Index (BMI)
The most commonly used indicator using your weight and height.
29.49 Overweight
29.49
BMI or Body Mass Index is a very commonly used indicator for obesity. The possible ranges for this index are based on your Weight to a reference of Height.
One of the main challenges with this indicator is that it does not take into consideration how the weight is distributed - so it may not be a good reference for any individual that is active and exercising. For this purpose we leverage other mechanisms to help you determine what type of body composition you have based on other formulas.
6' 0"
Height
217.0lbs
Weight
Understanding your data
Looking at your current Height we can provide you additional information on what each of the Body Mass Index Ranges represent in actual Weight. This can show you additional reference points based on where you are, have been or would like to be weight wise and how this is mapped to the BMI value ranges.
34.9
256.79 lbs
256.79 lbs
39.9
293.58 lbs
293.58 lbs
29.9
220.0 lbs
220.0 lbs
C1 Obese
34.9
256.79 lbs
256.79 lbs
24.9
183.21 lbs
183.21 lbs
Overweight
29.9
220.0 lbs
220.0 lbs
18.5
136.12 lbs
136.12 lbs
Normal
24.9
183.21 lbs
183.21 lbs
16.5
121.41 lbs
121.41 lbs
Underweight
18.5
136.12 lbs
136.12 lbs
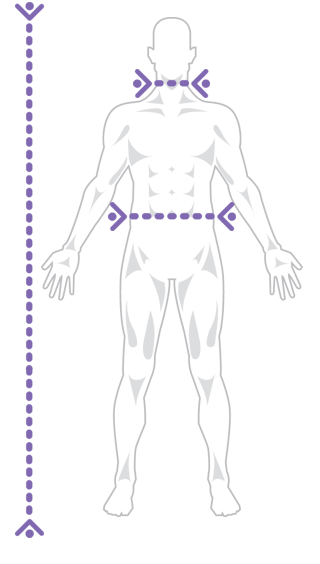
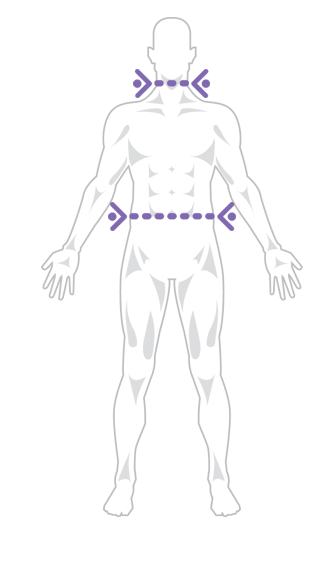
Waist to Hip Ratio (WHR)
Looking at both Waist and Hip to determine level of obesity.
n/a
n/a
The Waist to Hip ratio is another commonly used indicator to measure obesity. One of the advantages of this ratio is that both the Waist and the Hip measurement are variable in nature giving a good indication of progress as an individual changes body fat composition.
n/a
Hip
32.0"
Waist
Understanding your data
Knowing that both your waist and hip can change at any given time, how will this translate back into understanding the WHR ranges? Review your Waist vs your Hip to understand how changes scale in reference to this Health Indicator.
Range Data available when Waist and Hip data is is provided.
Waist to Height Ratio (WtHR)
A simpler view at your waist to determine general health.
0.44 Slender and Healthy
0.44
The Waist to Height ratio is another commonly used indicator to measure obesity. The possible ranges for this index are based off your static Height and change as your body composition changes for your Waist. It is important to note that only changes in your Waist will have an impact on the value of this indicator.
6' 0"
Height
32.0"
Waist
Understanding your data
Looking at your current Height we can provide you additional information on what each of the Health Indicator Ranges represent in actual Waist.
0.58
41.76"
41.76"
Extremely Overweight/Obese
0.63
45.36"
45.36"
0.53
38.16"
38.16"
Overweight
0.58
41.76"
41.76"
0.46
33.12"
33.12"
Healthy/Normal Weight
0.53
38.16"
38.16"
0.43
30.96"
30.96"
Slender and Healthy
0.46
33.12"
33.12"
0.35
25.2"
25.2"
Extremely slim
0.43
30.96"
30.96"
Body Fat Analysis
Health indicators give you one view into your composition - the next important piece is looking at your body fat in more detail. There are various ways to measure body fat - we focus on body fat analysis using simple tools of measuring the circumference of various body locations and/or your weight. Finally, you can take it one step further by apply skinfold based measurements - while more difficult to measure, they may provide better accuracy.
Navy HodgdonWeight basedPreferred
25.37 Obese
25.37
| Based On | Weight | Tape Measure | Skinfold |
| Measurement Complexity | Very Easy | Easy | Difficult |
| Accuracy/Precision | Low | Medium | High |
| Best Suited For | Non-Active Person | Active Enthusiast | Athlete |
6' 0"
Height
217.0lbs
Weight
Understanding your data
You can now get further insights into the body fat ranges to determine how your weight compares against the various levels.
18.0
182.04 lbs
182.04 lbs
Average
25.0
215.23 lbs
215.23 lbs
14.0
163.08 lbs
163.08 lbs
Fitness
18.0
182.04 lbs
182.04 lbs
6.0
125.15 lbs
125.15 lbs
Athletes
14.0
163.08 lbs
163.08 lbs
BMIWeight based
27.24 Obese
27.24
| Based On | Weight | Tape Measure | Skinfold |
| Measurement Complexity | Very Easy | Easy | Difficult |
| Accuracy/Precision | Low | Medium | High |
| Best Suited For | Non-Active Person | Active Enthusiast | Athlete |
35
Age
29.49kg/m2
Body Mass Index (BMI)
Understanding your data
You can now get further insights into the body fat ranges to determine how both your Age and Weight changes impact the various levels.
Age | ||||||||||||||||||||||||||||||||||||||||||||||||||||||||||||||||||||||||||||||||||||||||||||||||||||
| 15 -20 | 23 -12 | 29 -6 | 33 -2 | 35 | 37 2 | 41 6 | 47 12 | 55 20 | ||||||||||||||||||||||||||||||||||||||||||||||||||||||||||||||||||||||||||||||||||||||||||||
W e i g h t | 197.0 -20.0 | 19.38 Average | 22.6 Average | 23.98 Average | 25.36 Obese | 28.58 Obese | ||||||||||||||||||||||||||||||||||||||||||||||||||||||||||||||||||||||||||||||||||||||||||||||
| 205.0 -12.0 | 20.68 Average | 23.9 Average | 25.28 Obese | 26.66 Obese | 29.88 Obese | |||||||||||||||||||||||||||||||||||||||||||||||||||||||||||||||||||||||||||||||||||||||||||||||
| 211.0 -6.0 | 21.66 Average | 24.88 Average | 26.26 Obese | 27.64 Obese | 30.86 Obese | |||||||||||||||||||||||||||||||||||||||||||||||||||||||||||||||||||||||||||||||||||||||||||||||
| 215.0 -2.0 | 22.31 Average | 25.53 Obese | 26.91 Obese | 28.29 Obese | 31.51 Obese | |||||||||||||||||||||||||||||||||||||||||||||||||||||||||||||||||||||||||||||||||||||||||||||||
| 217.0 | 22.64 Average | 25.86 Obese | 27.24 Obese | 28.62 Obese | 31.84 Obese | |||||||||||||||||||||||||||||||||||||||||||||||||||||||||||||||||||||||||||||||||||||||||||||||
| 219.0 2.0 | 22.97 Average | 26.19 Obese | 27.57 Obese | 28.95 Obese | 32.17 Obese | |||||||||||||||||||||||||||||||||||||||||||||||||||||||||||||||||||||||||||||||||||||||||||||||
| 223.0 6.0 | 23.62 Average | 26.84 Obese | 28.22 Obese | 29.6 Obese | 32.82 Obese | |||||||||||||||||||||||||||||||||||||||||||||||||||||||||||||||||||||||||||||||||||||||||||||||
| 229.0 12.0 | 24.6 Average | 27.82 Obese | 29.2 Obese | 30.58 Obese | 33.8 Obese | |||||||||||||||||||||||||||||||||||||||||||||||||||||||||||||||||||||||||||||||||||||||||||||||
| 237.0 20.0 | 25.9 Obese | 29.12 Obese | 30.5 Obese | 31.88 Obese | 35.1 Obese | |||||||||||||||||||||||||||||||||||||||||||||||||||||||||||||||||||||||||||||||||||||||||||||||
Army FriedlMeasurement based
n/a
n/a
| Based On | Weight | Tape Measure | Skinfold |
| Measurement Complexity | Very Easy | Easy | Difficult |
| Accuracy/Precision | Low | Medium | High |
| Best Suited For | Non-Active Person | Active Enthusiast | Athlete |
6' 0"
Height
n/a
Neck
n/a
Abdomen
Understanding your data
Range Data available when measurements are provided.
Navy Hodgdon & BeckettMeasurement based
n/a
n/a
| Based On | Weight | Tape Measure | Skinfold |
| Measurement Complexity | Very Easy | Easy | Difficult |
| Accuracy/Precision | Low | Medium | High |
| Best Suited For | Non-Active Person | Active Enthusiast | Athlete |
6' 0"
Height
n/a
Neck
n/a
Abdomen
Understanding your data
Range Data available when measurements are provided.
Marine Corps WrightMeasurement based
n/a
n/a
| Based On | Weight | Tape Measure | Skinfold |
| Measurement Complexity | Very Easy | Easy | Difficult |
| Accuracy/Precision | Low | Medium | High |
| Best Suited For | Non-Active Person | Active Enthusiast | Athlete |
n/a
Neck
n/a
Abdomen
Understanding your data
Range Data available when measurements are provided.
Army VogelMeasurement based
n/a
n/a
| Based On | Weight | Tape Measure | Skinfold |
| Measurement Complexity | Very Easy | Easy | Difficult |
| Accuracy/Precision | Low | Medium | High |
| Best Suited For | Non-Active Person | Active Enthusiast | Athlete |
6' 0"
Height
n/a
Neck
n/a
Abdomen
Understanding your data
Range Data available when measurements are provided.
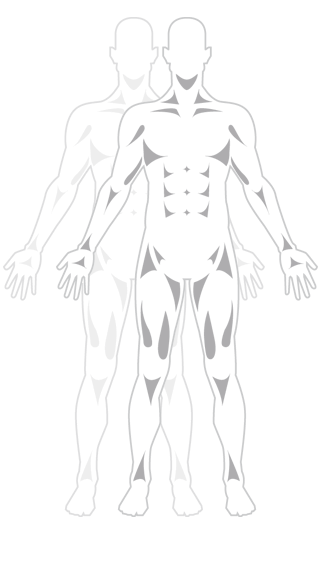
Lean Body Mass Analysis
Expanding on the body fat formulas used above, we are taking a closer look at your Lean Body Mass to give you additional insights. Keep in mind, while our body fat formulas are estimate based, they can help greatly in giving you an idea of progress from a muscular perspective.
Fat Free Mass Index (FFMI)
Looking at your lean body mass to determine general fitness.
21.83 Well above average
21.83
The fat free Mass index is an indicator primarily focused on muscle composition after having subtracted your body fat based on your current Body Fat Preferences. Similar to the BMI it is based off using your weight and height as a parameter. However, for the FFMI we are removing the fat mass based on the body fat we estimate to only compare your fat free mass (ie lean body mass).
Keep in mind that numbers for FFMI are estimated and driven primarily based on the accuracy of your body fat.
6' 0"
Height
217.0lbs
Weight
25.37%
Body FatNavy Hodgdon
Understanding your data
Lean Body Mass and Body Fat go hand in hand. In reality, the Lean Body Mass is an estimate based on your body fat estimate. So it becomes a bit difficult to accurately represent your true lean body mass. As a result, we wanted to make sure we provide you insights into various lean body mass levels, against body fat and the FFMI ranges.
| Formula | FFMI | Lean Body Mass | LBM Difference | Body Fat 5.0 % | Body Fat 10.0 % | Body Fat 17.69 %(-7.69 %) | Body Fat 25.37 % | Body Fat 30.37 %(5.0 %) |
|---|---|---|---|---|---|---|---|---|
| Unicorn | 30.0 | 222.03 lbs | 60.09 lbs | 233.72 lbs | 246.7 lbs | 269.74 lbs | 297.52 lbs | 318.88 lbs |
| Superior (Genetics) | 28.0 | 207.31 lbs | 45.37 lbs | 218.23 lbs | 230.35 lbs | 251.86 lbs | 277.8 lbs | 297.75 lbs |
| Superior | 26.0 | 192.6 lbs | 30.66 lbs | 202.74 lbs | 214.0 lbs | 233.98 lbs | 258.08 lbs | 276.61 lbs |
| Excellent | 23.0 | 170.52 lbs | 8.58 lbs | 179.5 lbs | 189.47 lbs | 207.16 lbs | 228.5 lbs | 244.91 lbs |
| Well above average | 22.0 | 163.17 lbs | 1.23 lbs | 171.75 lbs | 181.3 lbs | 198.23 lbs | 218.64 lbs | 234.34 lbs |
| Your Results | 21.83 | 161.94 lbs | n/a | 170.46 lbs | 179.93 lbs | 196.74 lbs | 217.0 lbs | 232.58 lbs |
| Above Average | 21.0 | 155.81 lbs | -6.13 lbs | 164.01 lbs | 173.12 lbs | 189.29 lbs | 208.78 lbs | 223.78 lbs |
| Average | 20.0 | 148.45 lbs | -13.49 lbs | 156.26 lbs | 164.95 lbs | 180.35 lbs | 198.92 lbs | 213.21 lbs |
| Well below average | 18.0 | 133.74 lbs | -28.21 lbs | 140.77 lbs | 148.59 lbs | 162.47 lbs | 179.2 lbs | 192.07 lbs |
Lean Body Mass Potential
How much more muscle can you gain?
20.39 lbs
20.39 lbs


Based on the data we have available for you, we estimate your current lean body mass at approx 161.94 lbs.
Various industry experts have created detailed formulas by reviewing natural body builders to try to come up with mechanisms to predict an individual's potential. To better understand your potential we are analysing the following three components:
Your Lean Body Mass Potential
The difference of lean body mass that is achievable
Your potential weight at current body fat levels
The difference of lean body mass that is achievable
Your potential weight at current body fat levels
6' 0"
Height
n/a
Wrist
n/a
Ankle
217.0lbs
Weight
25.37%
Body FatNavy Hodgdon
Casey Butt, Ph.D.
Casey Butt, Ph.D. analyzed approx. 300 natural bodybuilding champions between the years of 1947 and 2010, in their best condition. Casey's formula is probably the most sophisticated and looking at many measures including Height, Wrist and Ankle to try to predict your potential. For the purposes of this formula we are assuming a body fat level of 10%.
Lean Body Mass Potential
n/a
Difference
n/a
Weight @ your current BF%
n/a

Martin Berkhan
Martin Berkhan refers to your height. One stipulation exists where the lean body mass is assumed at a body fat level of 5%.
Lean Body Mass Potential
182.34 lbs
Difference
20.39 lbs
Weight @ your current BF%
244.33 lbs
Fat Free Mass Index Boundary
Many consider that a Fat Free Mass index of 24 is the upper boundary for natural limits. As a result we look at your Height to calculate your lean body mass at that specific level.
Lean Body Mass Potential
177.88 lbs
Difference
15.94 lbs
Weight @ your current BF%
238.36 lbs
Marc Perry
Marc Perry looks at natural potential with a short hand approach by purely looking at your height to predict a possible maximum. Its simply a scaling formula increasing/decreasing by the same amount for every inch in height.

Lean Body Mass Potential
170.0 lbs
Difference
8.06 lbs
Weight @ your current BF%
227.8 lbs
Understanding Your Data
Obviously your Lean Body mass potential is impacted by your current Body Fat levels, so getting a better idea of where your actual weight has to be based on the different lean body mass levels can provide you additional information to better determine what you should be targetting at different body fat levels.
| Formula | Lean Body Mass | LBM Difference | Body Fat 5.0 % | Body Fat 10.0 % | Body Fat 17.69 %(-7.69 %) | Body Fat 25.37 % | Body Fat 30.37 %(5.0 %) |
|---|---|---|---|---|---|---|---|
| Casey Butt, Ph.D. | n/a | n/a | n/a | *n/a | n/a | n/a | n/a |
| Martin Berkhan | 182.34 lbs | 20.39 lbs | *191.93 lbs | 202.6 lbs | 221.51 lbs | 244.33 lbs | 261.87 lbs |
| Fat Free Mass Index Boundary | 177.88 lbs | 15.94 lbs | 187.24 lbs | 197.65 lbs | 216.1 lbs | 238.36 lbs | 255.48 lbs |
| Marc Perry | 170.0 lbs | 8.06 lbs | 178.95 lbs | 188.89 lbs | 206.53 lbs | 227.8 lbs | 244.16 lbs |
| Your Results | 161.94 lbs | n/a | 170.46 lbs | 179.93 lbs | 196.74 lbs | 217.0 lbs | 232.58 lbs |
Years of Training
How much longer do you have to reach your full potential?
n/a
n/a

Now that we have a solid understanding of what your potential Lean Body Mass ranges are, we want to dial in on what this means for you in regards to timing, ie, how long is it going to take you to reach those limits?
Another interesting formula done by Casey Butt in combination with his research to better understand how long it will take you to reach your maximum potential.
n/a
Wrist
Annual Gain Potential
Figure out how lean body mass gains scale year over year. You guessed it, 50% aka your "Noob Gains" can be had in the first year of training
Potential Lean Body mass Gains are available once you provide a wrist measurement.
Annual breakdown available once you provide a wrist measurement.
Rate Of Gain - Comparisons
Now lets combine it all together, based on the potential lean body mass formula and the rate of gain, we can further determine how much time you have left before you reach your full potential.
Casey Butt, Ph.D.
Estimates for this Lean Body Mass Rate of Gain will be available
once we have required measurements and lean body mass formula estimates.
Marc Perry
Estimates for this Lean Body Mass Rate of Gain will be available
once we have required measurements and lean body mass formula estimates.
Martin Berkhan
Estimates for this Lean Body Mass Rate of Gain will be available
once we have required measurements and lean body mass formula estimates.
Fat Free Mass Index Boundary
Estimates for this Lean Body Mass Rate of Gain will be available
once we have required measurements and lean body mass formula estimates.