C2 Obese
Share this link or keep it for future reference. https://www.fitmatic.com/body/calculator/results?id=e24deeec-2b74-4c11-96a7-49b3d1165ca5 Copy to ClipboardNew Snapshot
Age
23 Years
Height
5' 3.5"
Weight
125.0 lbs
Body Fat %
24.65%
Navy Hodgdon
Navy Hodgdon
Health Indicators
To determine the current state of your body, Doctors and health industry professionals can refer to three indicators that describe your level of obesity. At Fitmatic, we are taking the same approach, but adding better tools and visualizations to allow you to measure your progress and keep you tied to goals.
Body Mass Index (BMI)
The most commonly used indicator using your weight and height.
21.84 Normal
21.84
BMI or Body Mass Index is a very commonly used indicator for obesity. The possible ranges for this index are based on your Weight to a reference of Height.
One of the main challenges with this indicator is that it does not take into consideration how the weight is distributed - so it may not be a good reference for any individual that is active and exercising. For this purpose we leverage other mechanisms to help you determine what type of body composition you have based on other formulas.
5' 3.5"
Height
125.0lbs
Weight
Understanding your data
Looking at your current Height we can provide you additional information on what each of the Body Mass Index Ranges represent in actual Weight. This can show you additional reference points based on where you are, have been or would like to be weight wise and how this is mapped to the BMI value ranges.
34.9
199.74 lbs
199.74 lbs
39.9
228.35 lbs
228.35 lbs
29.9
171.12 lbs
171.12 lbs
C1 Obese
34.9
199.74 lbs
199.74 lbs
24.9
142.51 lbs
142.51 lbs
Overweight
29.9
171.12 lbs
171.12 lbs
18.5
105.88 lbs
105.88 lbs
Normal
24.9
142.51 lbs
142.51 lbs
16.5
94.43 lbs
94.43 lbs
Underweight
18.5
105.88 lbs
105.88 lbs
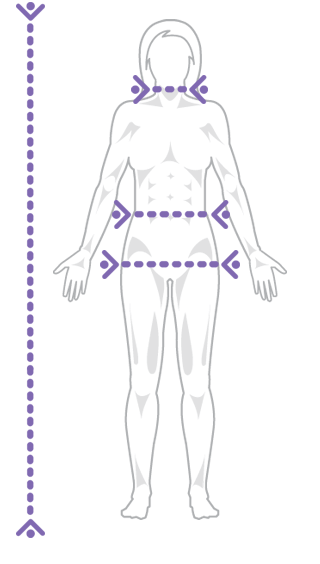
Waist to Hip Ratio (WHR)
Looking at both Waist and Hip to determine level of obesity.
0.72 Excellent
0.72
The Waist to Hip ratio is another commonly used indicator to measure obesity. One of the advantages of this ratio is that both the Waist and the Hip measurement are variable in nature giving a good indication of progress as an individual changes body fat composition.
39.0"
Hip
28.0"
Waist
Understanding your data
Knowing that both your waist and hip can change at any given time, how will this translate back into understanding the WHR ranges? Review your Waist vs your Hip to understand how changes scale in reference to this Health Indicator.
Waist | ||||||||||||||||||||||||||||||||||||||||||||||||||||||||||||||||||||||||||||||||||||||||||||||||||||
| 25.5" -2.5" | 26.5" -1.5" | 27.25" -0.75" | 27.75" -0.25" | 28.0" | 28.25" 0.25" | 28.75" 0.75" | 29.5" 1.5" | 30.5" 2.5" | ||||||||||||||||||||||||||||||||||||||||||||||||||||||||||||||||||||||||||||||||||||||||||||
H i p | 46.5" 7.5" | 0.55 Excellent | 0.59 Excellent | 0.6 Excellent | 0.62 Excellent | 0.66 Excellent | ||||||||||||||||||||||||||||||||||||||||||||||||||||||||||||||||||||||||||||||||||||||||||||||
| 44.0" 5.0" | 0.58 Excellent | 0.62 Excellent | 0.64 Excellent | 0.65 Excellent | 0.69 Excellent | |||||||||||||||||||||||||||||||||||||||||||||||||||||||||||||||||||||||||||||||||||||||||||||||
| 42.0" 3.0" | 0.61 Excellent | 0.65 Excellent | 0.67 Excellent | 0.68 Excellent | 0.73 Excellent | |||||||||||||||||||||||||||||||||||||||||||||||||||||||||||||||||||||||||||||||||||||||||||||||
| 40.5" 1.5" | 0.63 Excellent | 0.67 Excellent | 0.69 Excellent | 0.71 Excellent | 0.75 Good | |||||||||||||||||||||||||||||||||||||||||||||||||||||||||||||||||||||||||||||||||||||||||||||||
| 39.5" 0.5" | 0.65 Excellent | 0.69 Excellent | 0.71 Excellent | 0.73 Excellent | 0.77 Good | |||||||||||||||||||||||||||||||||||||||||||||||||||||||||||||||||||||||||||||||||||||||||||||||
| 39.0" | 0.65 Excellent | 0.7 Excellent | 0.72 Excellent | 0.74 Excellent | 0.78 Good | |||||||||||||||||||||||||||||||||||||||||||||||||||||||||||||||||||||||||||||||||||||||||||||||
| 38.5" -0.5" | 0.66 Excellent | 0.71 Excellent | 0.73 Excellent | 0.75 Excellent | 0.79 Good | |||||||||||||||||||||||||||||||||||||||||||||||||||||||||||||||||||||||||||||||||||||||||||||||
| 37.5" -1.5" | 0.68 Excellent | 0.73 Excellent | 0.75 Excellent | 0.77 Good | 0.81 Average | |||||||||||||||||||||||||||||||||||||||||||||||||||||||||||||||||||||||||||||||||||||||||||||||
| 36.0" -3.0" | 0.71 Excellent | 0.76 Good | 0.78 Good | 0.8 Good | 0.85 Average | |||||||||||||||||||||||||||||||||||||||||||||||||||||||||||||||||||||||||||||||||||||||||||||||
| 34.0" -5.0" | 0.75 Excellent | 0.8 Average | 0.82 Average | 0.85 Average | 0.9 High | |||||||||||||||||||||||||||||||||||||||||||||||||||||||||||||||||||||||||||||||||||||||||||||||
| 31.5" -7.5" | 0.81 Average | 0.87 High | 0.89 High | 0.91 Extreme | 0.97 Extreme | |||||||||||||||||||||||||||||||||||||||||||||||||||||||||||||||||||||||||||||||||||||||||||||||
Waist to Height Ratio (WtHR)
A simpler view at your waist to determine general health.
0.44 Slender and Healthy
0.44
The Waist to Height ratio is another commonly used indicator to measure obesity. The possible ranges for this index are based off your static Height and change as your body composition changes for your Waist. It is important to note that only changes in your Waist will have an impact on the value of this indicator.
5' 3.5"
Height
28.0"
Waist
Understanding your data
Looking at your current Height we can provide you additional information on what each of the Health Indicator Ranges represent in actual Waist.
0.54
34.29"
34.29"
Extremely Overweight/Obese
0.58
36.83"
36.83"
0.49
31.11"
31.11"
Overweight
0.54
34.29"
34.29"
0.46
29.21"
29.21"
Healthy/Normal Weight
0.49
31.11"
31.11"
0.42
26.67"
26.67"
Slender and Healthy
0.46
29.21"
29.21"
0.35
22.22"
22.22"
Extremely slim
0.42
26.67"
26.67"
Body Fat Analysis
Health indicators give you one view into your composition - the next important piece is looking at your body fat in more detail. There are various ways to measure body fat - we focus on body fat analysis using simple tools of measuring the circumference of various body locations and/or your weight. Finally, you can take it one step further by apply skinfold based measurements - while more difficult to measure, they may provide better accuracy.
Navy HodgdonWeight basedPreferred
24.65 Fitness
24.65
| Based On | Weight | Tape Measure | Skinfold |
| Measurement Complexity | Very Easy | Easy | Difficult |
| Accuracy/Precision | Low | Medium | High |
| Best Suited For | Non-Active Person | Active Enthusiast | Athlete |
5' 3.5"
Height
125.0lbs
Weight
Understanding your data
You can now get further insights into the body fat ranges to determine how your weight compares against the various levels.
25.0
126.21 lbs
126.21 lbs
Average
32.0
150.35 lbs
150.35 lbs
21.0
112.42 lbs
112.42 lbs
Fitness
25.0
126.21 lbs
126.21 lbs
14.0
88.28 lbs
88.28 lbs
Athletes
21.0
112.42 lbs
112.42 lbs
BMIWeight based
26.1 Average
26.1
| Based On | Weight | Tape Measure | Skinfold |
| Measurement Complexity | Very Easy | Easy | Difficult |
| Accuracy/Precision | Low | Medium | High |
| Best Suited For | Non-Active Person | Active Enthusiast | Athlete |
23
Age
21.84kg/m2
Body Mass Index (BMI)
Understanding your data
You can now get further insights into the body fat ranges to determine how both your Age and Weight changes impact the various levels.
Age | ||||||||||||||||||||||||||||||||||||||||||||||||||||||||||||||||||||||||||||||||||||||||||||||||||||
| 3 -20 | 11 -12 | 17 -6 | 21 -2 | 23 | 25 2 | 29 6 | 35 12 | 43 20 | ||||||||||||||||||||||||||||||||||||||||||||||||||||||||||||||||||||||||||||||||||||||||||||
W e i g h t | 105.0 -20.0 | 17.31 Athletes | 20.53 Athletes | 21.91 Fitness | 23.29 Fitness | 26.51 Average | ||||||||||||||||||||||||||||||||||||||||||||||||||||||||||||||||||||||||||||||||||||||||||||||
| 113.0 -12.0 | 18.98 Athletes | 22.2 Fitness | 23.58 Fitness | 24.96 Fitness | 28.18 Average | |||||||||||||||||||||||||||||||||||||||||||||||||||||||||||||||||||||||||||||||||||||||||||||||
| 119.0 -6.0 | 20.24 Athletes | 23.46 Fitness | 24.84 Fitness | 26.22 Average | 29.44 Average | |||||||||||||||||||||||||||||||||||||||||||||||||||||||||||||||||||||||||||||||||||||||||||||||
| 123.0 -2.0 | 21.08 Fitness | 24.3 Fitness | 25.68 Average | 27.06 Average | 30.28 Average | |||||||||||||||||||||||||||||||||||||||||||||||||||||||||||||||||||||||||||||||||||||||||||||||
| 125.0 | 21.5 Fitness | 24.72 Fitness | 26.1 Average | 27.48 Average | 30.7 Average | |||||||||||||||||||||||||||||||||||||||||||||||||||||||||||||||||||||||||||||||||||||||||||||||
| 127.0 2.0 | 21.92 Fitness | 25.14 Average | 26.52 Average | 27.9 Average | 31.12 Average | |||||||||||||||||||||||||||||||||||||||||||||||||||||||||||||||||||||||||||||||||||||||||||||||
| 131.0 6.0 | 22.76 Fitness | 25.98 Average | 27.36 Average | 28.74 Average | 31.96 Average | |||||||||||||||||||||||||||||||||||||||||||||||||||||||||||||||||||||||||||||||||||||||||||||||
| 137.0 12.0 | 24.02 Fitness | 27.24 Average | 28.62 Average | 30.0 Average | 33.22 Obese | |||||||||||||||||||||||||||||||||||||||||||||||||||||||||||||||||||||||||||||||||||||||||||||||
| 145.0 20.0 | 25.69 Average | 28.91 Average | 30.29 Average | 31.67 Average | 34.89 Obese | |||||||||||||||||||||||||||||||||||||||||||||||||||||||||||||||||||||||||||||||||||||||||||||||
Navy Hodgdon & BeckettMeasurement based
28.65 Average
28.65
| Based On | Weight | Tape Measure | Skinfold |
| Measurement Complexity | Very Easy | Easy | Difficult |
| Accuracy/Precision | Low | Medium | High |
| Best Suited For | Non-Active Person | Active Enthusiast | Athlete |
5' 3.5"
Height
12.5"
Neck
28.0"
Waist
39.0"
Hip
Lean Body Mass Analysis
Expanding on the body fat formulas used above, we are taking a closer look at your Lean Body Mass to give you additional insights. Keep in mind, while our body fat formulas are estimate based, they can help greatly in giving you an idea of progress from a muscular perspective.
Fat Free Mass Index (FFMI)
Looking at your lean body mass to determine general fitness.
17.6 Superior (Genetics)
17.6
The fat free Mass index is an indicator primarily focused on muscle composition after having subtracted your body fat based on your current Body Fat Preferences. Similar to the BMI it is based off using your weight and height as a parameter. However, for the FFMI we are removing the fat mass based on the body fat we estimate to only compare your fat free mass (ie lean body mass).
Keep in mind that numbers for FFMI are estimated and driven primarily based on the accuracy of your body fat.
5' 3.5"
Height
125.0lbs
Weight
24.65%
Body FatNavy Hodgdon
Understanding your data
Lean Body Mass and Body Fat go hand in hand. In reality, the Lean Body Mass is an estimate based on your body fat estimate. So it becomes a bit difficult to accurately represent your true lean body mass. As a result, we wanted to make sure we provide you insights into various lean body mass levels, against body fat and the FFMI ranges.
| Formula | FFMI | Lean Body Mass | LBM Difference | Body Fat 12.0 % | Body Fat 17.0 % | Body Fat 20.82 %(-3.82 %) | Body Fat 24.65 % | Body Fat 29.65 %(5.0 %) |
|---|---|---|---|---|---|---|---|---|
| Superior (Genetics) | 22.0 | 119.38 lbs | 25.19 lbs | 135.66 lbs | 143.83 lbs | 150.78 lbs | 158.43 lbs | 169.69 lbs |
| Your Results | 17.6 | 94.19 lbs | n/a | 107.03 lbs | 113.48 lbs | 118.96 lbs | 125.0 lbs | 133.88 lbs |
| Excellent | 17.0 | 90.76 lbs | -3.43 lbs | 103.14 lbs | 109.35 lbs | 114.63 lbs | 120.45 lbs | 129.01 lbs |
| Average Musculature | 15.0 | 79.32 lbs | -14.87 lbs | 90.13 lbs | 95.56 lbs | 100.18 lbs | 105.26 lbs | 112.74 lbs |
| Low Musculature | 13.0 | 67.87 lbs | -26.32 lbs | 77.12 lbs | 81.77 lbs | 85.72 lbs | 90.07 lbs | 96.47 lbs |