Average
Share this link or keep it for future reference. https://www.fitmatic.com/body/calculator/results?id=a5df94db-fd56-43d4-9173-b48fef0cd8a8 Copy to ClipboardNew Snapshot
Age
25 Years
Height
5' 7.5"
Weight
197.6 lbs
Body Fat %
25.76%
Marine Corps Wright
Marine Corps Wright
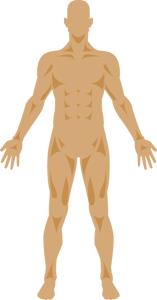
Body Fat Analysis
Health indicators give you one view into your composition - the next important piece is looking at your body fat in more detail. There are various ways to measure body fat - we focus on body fat analysis using simple tools of measuring the circumference of various body locations and/or your weight. Finally, you can take it one step further by apply skinfold based measurements - while more difficult to measure, they may provide better accuracy.
Marine Corps WrightMeasurement basedPreferred
25.76 Obese
25.76
| Based On | Weight | Tape Measure | Skinfold |
| Measurement Complexity | Very Easy | Easy | Difficult |
| Accuracy/Precision | Low | Medium | High |
| Best Suited For | Non-Active Person | Active Enthusiast | Athlete |
15.0"
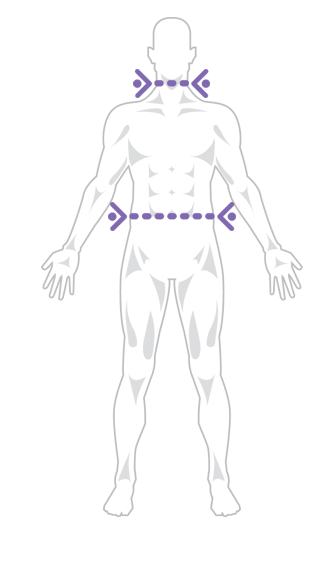
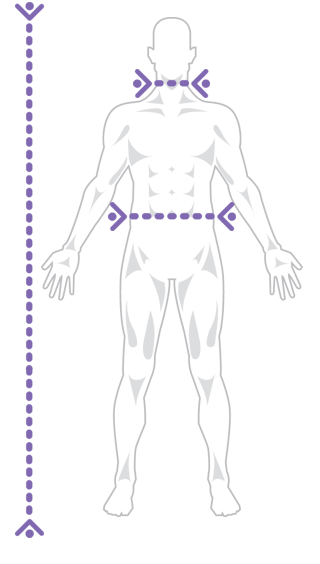
Neck
38.5"
Abdomen
Understanding your data
You can now get further insights into the body fat ranges to determine how both your Neck and Abdomen changes impact the various levels.
Neck | ||||||||||||||||||||||||||||||||||||||||||||||||||||||||||||||||||||||||||||||||||||||||||||||||||||
| 16.5" 1.5" | 15.75" 0.75" | 15.25" 0.25" | 15.0" | 14.75" -0.25" | 14.25" -0.75" | 13.5" -1.5" | ||||||||||||||||||||||||||||||||||||||||||||||||||||||||||||||||||||||||||||||||||||||||||||||
A b d o m e n | 35.5" -3.0" | 15.37 Fitness | 19.33 Average | 20.92 Average | 24.88 Average | |||||||||||||||||||||||||||||||||||||||||||||||||||||||||||||||||||||||||||||||||||||||||||||||
| 36.7" -1.8" | 17.62 Fitness | 21.59 Average | 23.17 Average | 27.14 Obese | ||||||||||||||||||||||||||||||||||||||||||||||||||||||||||||||||||||||||||||||||||||||||||||||||
| 37.6" -0.9" | 19.31 Average | 23.28 Average | 24.86 Average | 28.83 Obese | ||||||||||||||||||||||||||||||||||||||||||||||||||||||||||||||||||||||||||||||||||||||||||||||||
| 38.2" -0.3" | 20.44 Average | 24.41 Average | 25.99 Obese | 29.96 Obese | ||||||||||||||||||||||||||||||||||||||||||||||||||||||||||||||||||||||||||||||||||||||||||||||||
| 38.5" | 21.0 Average | 24.97 Average | 26.56 Obese | 30.52 Obese | ||||||||||||||||||||||||||||||||||||||||||||||||||||||||||||||||||||||||||||||||||||||||||||||||
| 38.8" 0.3" | 21.57 Average | 25.53 Obese | 27.12 Obese | 31.09 Obese | ||||||||||||||||||||||||||||||||||||||||||||||||||||||||||||||||||||||||||||||||||||||||||||||||
| 39.4" 0.9" | 22.7 Average | 26.66 Obese | 28.25 Obese | 32.21 Obese | ||||||||||||||||||||||||||||||||||||||||||||||||||||||||||||||||||||||||||||||||||||||||||||||||
| 40.3" 1.8" | 24.39 Average | 28.35 Obese | 29.94 Obese | 33.9 Obese | ||||||||||||||||||||||||||||||||||||||||||||||||||||||||||||||||||||||||||||||||||||||||||||||||
| 41.5" 3.0" | 26.64 Obese | 30.61 Obese | 32.19 Obese | 36.16 Obese | ||||||||||||||||||||||||||||||||||||||||||||||||||||||||||||||||||||||||||||||||||||||||||||||||
Navy HodgdonWeight based
25.98 Obese
25.98
| Based On | Weight | Tape Measure | Skinfold |
| Measurement Complexity | Very Easy | Easy | Difficult |
| Accuracy/Precision | Low | Medium | High |
| Best Suited For | Non-Active Person | Active Enthusiast | Athlete |
5' 7.5"
Height
197.6lbs
Weight
Understanding your data
You can now get further insights into the body fat ranges to determine how your weight compares against the various levels.
18.0
159.77 lbs
159.77 lbs
25.0
192.96 lbs
192.96 lbs
14.0
140.8 lbs
140.8 lbs
Fitness
18.0
159.77 lbs
159.77 lbs
6.0
102.87 lbs
102.87 lbs
Athletes
14.0
140.8 lbs
140.8 lbs
BMIWeight based
26.22 Obese
26.22
| Based On | Weight | Tape Measure | Skinfold |
| Measurement Complexity | Very Easy | Easy | Difficult |
| Accuracy/Precision | Low | Medium | High |
| Best Suited For | Non-Active Person | Active Enthusiast | Athlete |
25
Age
30.56kg/m2
Body Mass Index (BMI)
Understanding your data
You can now get further insights into the body fat ranges to determine how both your Age and Weight changes impact the various levels.
Age | ||||||||||||||||||||||||||||||||||||||||||||||||||||||||||||||||||||||||||||||||||||||||||||||||||||
| 5 -20 | 13 -12 | 19 -6 | 23 -2 | 25 | 27 2 | 31 6 | 37 12 | 45 20 | ||||||||||||||||||||||||||||||||||||||||||||||||||||||||||||||||||||||||||||||||||||||||||||
W e i g h t | 177.6 -20.0 | 17.91 Fitness | 21.13 Average | 22.51 Average | 23.89 Average | 27.11 Obese | ||||||||||||||||||||||||||||||||||||||||||||||||||||||||||||||||||||||||||||||||||||||||||||||
| 185.6 -12.0 | 19.39 Average | 22.61 Average | 23.99 Average | 25.37 Obese | 28.59 Obese | |||||||||||||||||||||||||||||||||||||||||||||||||||||||||||||||||||||||||||||||||||||||||||||||
| 191.6 -6.0 | 20.5 Average | 23.72 Average | 25.1 Obese | 26.48 Obese | 29.7 Obese | |||||||||||||||||||||||||||||||||||||||||||||||||||||||||||||||||||||||||||||||||||||||||||||||
| 195.6 -2.0 | 21.25 Average | 24.47 Average | 25.85 Obese | 27.23 Obese | 30.45 Obese | |||||||||||||||||||||||||||||||||||||||||||||||||||||||||||||||||||||||||||||||||||||||||||||||
| 197.6 | 21.62 Average | 24.84 Average | 26.22 Obese | 27.6 Obese | 30.82 Obese | |||||||||||||||||||||||||||||||||||||||||||||||||||||||||||||||||||||||||||||||||||||||||||||||
| 199.6 2.0 | 21.99 Average | 25.21 Obese | 26.59 Obese | 27.97 Obese | 31.19 Obese | |||||||||||||||||||||||||||||||||||||||||||||||||||||||||||||||||||||||||||||||||||||||||||||||
| 203.6 6.0 | 22.73 Average | 25.95 Obese | 27.33 Obese | 28.71 Obese | 31.93 Obese | |||||||||||||||||||||||||||||||||||||||||||||||||||||||||||||||||||||||||||||||||||||||||||||||
| 209.6 12.0 | 23.84 Average | 27.06 Obese | 28.44 Obese | 29.82 Obese | 33.04 Obese | |||||||||||||||||||||||||||||||||||||||||||||||||||||||||||||||||||||||||||||||||||||||||||||||
| 217.6 20.0 | 25.33 Obese | 28.55 Obese | 29.93 Obese | 31.31 Obese | 34.53 Obese | |||||||||||||||||||||||||||||||||||||||||||||||||||||||||||||||||||||||||||||||||||||||||||||||
Navy Hodgdon & BeckettMeasurement based
26.46 Obese
26.46
| Based On | Weight | Tape Measure | Skinfold |
| Measurement Complexity | Very Easy | Easy | Difficult |
| Accuracy/Precision | Low | Medium | High |
| Best Suited For | Non-Active Person | Active Enthusiast | Athlete |
5' 7.5"
Height
15.0"
Neck
38.5"
Abdomen
Understanding your data
You can now get further insights into the body fat ranges to determine how both your Neck and Abdomen changes impact the various levels.
Neck | ||||||||||||||||||||||||||||||||||||||||||||||||||||||||||||||||||||||||||||||||||||||||||||||||||||
| 16.5" 1.5" | 15.75" 0.75" | 15.25" 0.25" | 15.0" | 14.75" -0.25" | 14.25" -0.75" | 13.5" -1.5" | ||||||||||||||||||||||||||||||||||||||||||||||||||||||||||||||||||||||||||||||||||||||||||||||
A b d o m e n | 35.5" -3.0" | 18.51 Average | 20.87 Average | 21.77 Average | 23.96 Average | |||||||||||||||||||||||||||||||||||||||||||||||||||||||||||||||||||||||||||||||||||||||||||||||
| 36.7" -1.8" | 20.78 Average | 23.01 Average | 23.88 Average | 25.97 Obese | ||||||||||||||||||||||||||||||||||||||||||||||||||||||||||||||||||||||||||||||||||||||||||||||||
| 37.6" -0.9" | 22.4 Average | 24.56 Average | 25.39 Obese | 27.42 Obese | ||||||||||||||||||||||||||||||||||||||||||||||||||||||||||||||||||||||||||||||||||||||||||||||||
| 38.2" -0.3" | 23.45 Average | 25.56 Obese | 26.38 Obese | 28.36 Obese | ||||||||||||||||||||||||||||||||||||||||||||||||||||||||||||||||||||||||||||||||||||||||||||||||
| 38.5" | 23.96 Average | 26.05 Obese | 26.86 Obese | 28.82 Obese | ||||||||||||||||||||||||||||||||||||||||||||||||||||||||||||||||||||||||||||||||||||||||||||||||
| 38.8" 0.3" | 24.47 Average | 26.54 Obese | 27.34 Obese | 29.28 Obese | ||||||||||||||||||||||||||||||||||||||||||||||||||||||||||||||||||||||||||||||||||||||||||||||||
| 39.4" 0.9" | 25.48 Obese | 27.5 Obese | 28.28 Obese | 30.18 Obese | ||||||||||||||||||||||||||||||||||||||||||||||||||||||||||||||||||||||||||||||||||||||||||||||||
| 40.3" 1.8" | 26.94 Obese | 28.9 Obese | 29.66 Obese | 31.5 Obese | ||||||||||||||||||||||||||||||||||||||||||||||||||||||||||||||||||||||||||||||||||||||||||||||||
| 41.5" 3.0" | 28.82 Obese | 30.7 Obese | 31.43 Obese | 33.21 Obese | ||||||||||||||||||||||||||||||||||||||||||||||||||||||||||||||||||||||||||||||||||||||||||||||||
Army FriedlMeasurement based
27.68 Obese
27.68
| Based On | Weight | Tape Measure | Skinfold |
| Measurement Complexity | Very Easy | Easy | Difficult |
| Accuracy/Precision | Low | Medium | High |
| Best Suited For | Non-Active Person | Active Enthusiast | Athlete |
5' 7.5"
Height
15.0"
Neck
38.5"
Abdomen
Understanding your data
You can now get further insights into the body fat ranges to determine how both your Neck and Abdomen changes impact the various levels.
Neck | ||||||||||||||||||||||||||||||||||||||||||||||||||||||||||||||||||||||||||||||||||||||||||||||||||||
| 16.5" 1.5" | 15.75" 0.75" | 15.25" 0.25" | 15.0" | 14.75" -0.25" | 14.25" -0.75" | 13.5" -1.5" | ||||||||||||||||||||||||||||||||||||||||||||||||||||||||||||||||||||||||||||||||||||||||||||||
A b d o m e n | 35.5" -3.0" | 18.87 Average | 21.31 Average | 22.29 Average | 24.74 Average | |||||||||||||||||||||||||||||||||||||||||||||||||||||||||||||||||||||||||||||||||||||||||||||||
| 36.7" -1.8" | 21.22 Average | 23.66 Average | 24.64 Average | 27.09 Obese | ||||||||||||||||||||||||||||||||||||||||||||||||||||||||||||||||||||||||||||||||||||||||||||||||
| 37.6" -0.9" | 22.98 Average | 25.43 Obese | 26.41 Obese | 28.85 Obese | ||||||||||||||||||||||||||||||||||||||||||||||||||||||||||||||||||||||||||||||||||||||||||||||||
| 38.2" -0.3" | 24.15 Average | 26.6 Obese | 27.58 Obese | 30.03 Obese | ||||||||||||||||||||||||||||||||||||||||||||||||||||||||||||||||||||||||||||||||||||||||||||||||
| 38.5" | 24.74 Average | 27.19 Obese | 28.17 Obese | 30.62 Obese | ||||||||||||||||||||||||||||||||||||||||||||||||||||||||||||||||||||||||||||||||||||||||||||||||
| 38.8" 0.3" | 25.33 Obese | 27.78 Obese | 28.76 Obese | 31.2 Obese | ||||||||||||||||||||||||||||||||||||||||||||||||||||||||||||||||||||||||||||||||||||||||||||||||
| 39.4" 0.9" | 26.5 Obese | 28.95 Obese | 29.93 Obese | 32.38 Obese | ||||||||||||||||||||||||||||||||||||||||||||||||||||||||||||||||||||||||||||||||||||||||||||||||
| 40.3" 1.8" | 28.27 Obese | 30.72 Obese | 31.69 Obese | 34.14 Obese | ||||||||||||||||||||||||||||||||||||||||||||||||||||||||||||||||||||||||||||||||||||||||||||||||
| 41.5" 3.0" | 30.62 Obese | 33.07 Obese | 34.04 Obese | 36.49 Obese | ||||||||||||||||||||||||||||||||||||||||||||||||||||||||||||||||||||||||||||||||||||||||||||||||
Army VogelMeasurement based
29.27 Obese
29.27
| Based On | Weight | Tape Measure | Skinfold |
| Measurement Complexity | Very Easy | Easy | Difficult |
| Accuracy/Precision | Low | Medium | High |
| Best Suited For | Non-Active Person | Active Enthusiast | Athlete |
5' 7.5"
Height
15.0"
Neck
38.5"
Abdomen
Understanding your data
You can now get further insights into the body fat ranges to determine how both your Neck and Abdomen changes impact the various levels.
Neck | ||||||||||||||||||||||||||||||||||||||||||||||||||||||||||||||||||||||||||||||||||||||||||||||||||||
| 16.5" 1.5" | 15.75" 0.75" | 15.25" 0.25" | 15.0" | 14.75" -0.25" | 14.25" -0.75" | 13.5" -1.5" | ||||||||||||||||||||||||||||||||||||||||||||||||||||||||||||||||||||||||||||||||||||||||||||||
A b d o m e n | 35.5" -3.0" | 22.21 Average | 24.33 Average | 25.14 Obese | 27.08 Obese | |||||||||||||||||||||||||||||||||||||||||||||||||||||||||||||||||||||||||||||||||||||||||||||||
| 36.7" -1.8" | 24.24 Average | 26.24 Obese | 27.0 Obese | 28.84 Obese | ||||||||||||||||||||||||||||||||||||||||||||||||||||||||||||||||||||||||||||||||||||||||||||||||
| 37.6" -0.9" | 25.69 Obese | 27.6 Obese | 28.34 Obese | 30.11 Obese | ||||||||||||||||||||||||||||||||||||||||||||||||||||||||||||||||||||||||||||||||||||||||||||||||
| 38.2" -0.3" | 26.62 Obese | 28.48 Obese | 29.2 Obese | 30.93 Obese | ||||||||||||||||||||||||||||||||||||||||||||||||||||||||||||||||||||||||||||||||||||||||||||||||
| 38.5" | 27.08 Obese | 28.92 Obese | 29.62 Obese | 31.33 Obese | ||||||||||||||||||||||||||||||||||||||||||||||||||||||||||||||||||||||||||||||||||||||||||||||||
| 38.8" 0.3" | 27.53 Obese | 29.34 Obese | 30.04 Obese | 31.72 Obese | ||||||||||||||||||||||||||||||||||||||||||||||||||||||||||||||||||||||||||||||||||||||||||||||||
| 39.4" 0.9" | 28.41 Obese | 30.18 Obese | 30.86 Obese | 32.5 Obese | ||||||||||||||||||||||||||||||||||||||||||||||||||||||||||||||||||||||||||||||||||||||||||||||||
| 40.3" 1.8" | 29.69 Obese | 31.39 Obese | 32.05 Obese | 33.64 Obese | ||||||||||||||||||||||||||||||||||||||||||||||||||||||||||||||||||||||||||||||||||||||||||||||||
| 41.5" 3.0" | 31.33 Obese | 32.95 Obese | 33.57 Obese | 35.09 Obese | ||||||||||||||||||||||||||||||||||||||||||||||||||||||||||||||||||||||||||||||||||||||||||||||||
Lean Body Mass Analysis
Expanding on the body fat formulas used above, we are taking a closer look at your Lean Body Mass to give you additional insights. Keep in mind, while our body fat formulas are estimate based, they can help greatly in giving you an idea of progress from a muscular perspective.
Fat Free Mass Index (FFMI)
Looking at your lean body mass to determine general fitness.
23.21 Superior
23.21
The fat free Mass index is an indicator primarily focused on muscle composition after having subtracted your body fat based on your current Body Fat Preferences. Similar to the BMI it is based off using your weight and height as a parameter. However, for the FFMI we are removing the fat mass based on the body fat we estimate to only compare your fat free mass (ie lean body mass).
Keep in mind that numbers for FFMI are estimated and driven primarily based on the accuracy of your body fat.
5' 7.5"
Height
197.6lbs
Weight
25.76%
Body FatMarine Corps Wright
Understanding your data
Lean Body Mass and Body Fat go hand in hand. In reality, the Lean Body Mass is an estimate based on your body fat estimate. So it becomes a bit difficult to accurately represent your true lean body mass. As a result, we wanted to make sure we provide you insights into various lean body mass levels, against body fat and the FFMI ranges.
| Formula | FFMI | Lean Body Mass | LBM Difference | Body Fat 5.0 % | Body Fat 10.0 % | Body Fat 17.88 %(-7.88 %) | Body Fat 25.76 % | Body Fat 30.76 %(5.0 %) |
|---|---|---|---|---|---|---|---|---|
| Unicorn | 30.0 | 190.63 lbs | 43.94 lbs | 200.67 lbs | 211.82 lbs | 232.15 lbs | 256.79 lbs | 275.34 lbs |
| Superior (Genetics) | 28.0 | 177.7 lbs | 31.01 lbs | 187.05 lbs | 197.45 lbs | 216.4 lbs | 239.37 lbs | 256.66 lbs |
| Superior | 26.0 | 164.77 lbs | 18.07 lbs | 173.44 lbs | 183.07 lbs | 200.65 lbs | 221.95 lbs | 237.97 lbs |
| Your Results | 23.21 | 146.69 lbs | n/a | 154.41 lbs | 162.99 lbs | 178.64 lbs | 197.6 lbs | 211.87 lbs |
| Excellent | 23.0 | 145.37 lbs | -1.33 lbs | 153.02 lbs | 161.52 lbs | 177.02 lbs | 195.81 lbs | 209.95 lbs |
| Well above average | 22.0 | 138.9 lbs | -7.79 lbs | 146.21 lbs | 154.33 lbs | 169.14 lbs | 187.1 lbs | 200.61 lbs |
| Above Average | 21.0 | 132.43 lbs | -14.26 lbs | 139.4 lbs | 147.15 lbs | 161.27 lbs | 178.39 lbs | 191.27 lbs |
| Average | 20.0 | 125.97 lbs | -20.73 lbs | 132.6 lbs | 139.96 lbs | 153.39 lbs | 169.68 lbs | 181.93 lbs |
| Well below average | 18.0 | 113.03 lbs | -33.66 lbs | 118.98 lbs | 125.59 lbs | 137.64 lbs | 152.26 lbs | 163.25 lbs |
Lean Body Mass Potential
How much more muscle can you gain?
20.12 lbs
20.12 lbs


Based on the data we have available for you, we estimate your current lean body mass at approx 146.69 lbs.
Various industry experts have created detailed formulas by reviewing natural body builders to try to come up with mechanisms to predict an individual's potential. To better understand your potential we are analysing the following three components:
Your Lean Body Mass Potential
The difference of lean body mass that is achievable
Your potential weight at current body fat levels
The difference of lean body mass that is achievable
Your potential weight at current body fat levels
5' 7.5"
Height
6.4"
Wrist
9.0"
Ankle
197.6lbs
Weight
25.76%
Body FatMarine Corps Wright
Casey Butt, Ph.D.
Casey Butt, Ph.D. analyzed approx. 300 natural bodybuilding champions between the years of 1947 and 2010, in their best condition. Casey's formula is probably the most sophisticated and looking at many measures including Height, Wrist and Ankle to try to predict your potential. For the purposes of this formula we are assuming a body fat level of 10%.
Lean Body Mass Potential
166.82 lbs
Difference
20.12 lbs
Weight @ your current BF%
224.71 lbs
Martin Berkhan
Martin Berkhan refers to your height. One stipulation exists where the lean body mass is assumed at a body fat level of 5%.
Lean Body Mass Potential
157.19 lbs
Difference
10.5 lbs
Weight @ your current BF%
211.74 lbs
Fat Free Mass Index Boundary
Many consider that a Fat Free Mass index of 24 is the upper boundary for natural limits. As a result we look at your Height to calculate your lean body mass at that specific level.
Lean Body Mass Potential
151.83 lbs
Difference
5.14 lbs
Weight @ your current BF%
204.52 lbs
Marc Perry
Marc Perry looks at natural potential with a short hand approach by purely looking at your height to predict a possible maximum. Its simply a scaling formula increasing/decreasing by the same amount for every inch in height.

Lean Body Mass Potential
147.5 lbs
Difference
0.81 lbs
Weight @ your current BF%
198.69 lbs
Understanding Your Data
Obviously your Lean Body mass potential is impacted by your current Body Fat levels, so getting a better idea of where your actual weight has to be based on the different lean body mass levels can provide you additional information to better determine what you should be targetting at different body fat levels.
| Formula | Lean Body Mass | LBM Difference | Body Fat 5.0 % | Body Fat 10.0 % | Body Fat 17.88 %(-7.88 %) | Body Fat 25.76 % | Body Fat 30.76 %(5.0 %) |
|---|---|---|---|---|---|---|---|
| Casey Butt, Ph.D. | 166.82 lbs | 20.12 lbs | 175.6 lbs | *185.35 lbs | 203.14 lbs | 224.71 lbs | 240.93 lbs |
| Martin Berkhan | 157.19 lbs | 10.5 lbs | *165.46 lbs | 174.66 lbs | 191.42 lbs | 211.74 lbs | 227.03 lbs |
| Fat Free Mass Index Boundary | 151.83 lbs | 5.14 lbs | 159.82 lbs | 168.7 lbs | 184.9 lbs | 204.52 lbs | 219.29 lbs |
| Marc Perry | 147.5 lbs | 0.81 lbs | 155.26 lbs | 163.89 lbs | 179.62 lbs | 198.69 lbs | 213.04 lbs |
| Your Results | 146.69 lbs | n/a | 154.41 lbs | 162.99 lbs | 178.64 lbs | 197.6 lbs | 211.87 lbs |
Years of Training
How much longer do you have to reach your full potential?
1.03 yrs
1.03 yrs

Now that we have a solid understanding of what your potential Lean Body Mass ranges are, we want to dial in on what this means for you in regards to timing, ie, how long is it going to take you to reach those limits?
Another interesting formula done by Casey Butt in combination with his research to better understand how long it will take you to reach your maximum potential.
6.4"
Wrist
Annual Gain Potential
Figure out how lean body mass gains scale year over year. You guessed it, 50% aka your "Noob Gains" can be had in the first year of training
| Training Year | Gains For Year | Gains From Total |
|---|---|---|
| Year 1 | 12.29 lbs | 51.61% |
| Year 2 | 6.14 lbs | 25.81% |
| Year 3 | 3.07 lbs | 12.9% |
| Year 4 | 1.54 lbs | 6.45% |
| Year 5 | 0.77 lbs | 3.23% |
| Total | 23.81 lbs | 100% |
Rate Of Gain - Comparisons
Now lets combine it all together, based on the potential lean body mass formula and the rate of gain, we can further determine how much time you have left before you reach your full potential.
Casey Butt, Ph.D.
0.3 Years
of training completed
This is based on the Lean Body Mass Potential Formula Casey Butt, Ph.D. with an estimated max of 166.82 lbsof training completed
Martin Berkhan
1.17 Years
of training completed
This is based on the Lean Body Mass Potential Formula Martin Berkhan with an estimated max of 157.19 lbsof training completed
Fat Free Mass Index Boundary
2.08 Years
of training completed
This is based on the Lean Body Mass Potential Formula Fat Free Mass Index Boundary with an estimated max of 151.83 lbsof training completed
Marc Perry
3.97 Years
of training completed
This is based on the Lean Body Mass Potential Formula Marc Perry with an estimated max of 147.5 lbsof training completed
Discover your Potential
Getting a better idea of where you are today and how you compare to various models, you can get additional information on how your current body compares. It may help to highlight specific weaknesses ... you know "oh my legs have always been lagging" (though we kind of know skipping leg days is too easy)
Muscular Potential
Discover your potential for muscular composition based on your body frame.
Casey Butt, Ph.D. created several equations that predict muscular measurements in lean condition of approximately 8% to 10% body fat. Height, ankle, and wrist circumference are the determining factors.
One caveat is in order: People with uncharacteristically small joints for their frames and/or significantly longer than typical muscle belly lengths may be able to exceed some of these predictions by up to approximately 3%.
Casey Butt, Ph.D. isolates formulas for muscular potential based on being a Hardgainer or an Easygainer. In it's most basic definition a "hardgainer" is simply someone who gains muscle more slowly and with more difficulty than the average trainee. For the purpose of identification of being a hard gainer or not, casey looks closely at a specific ratio of your height in comparison to either wrist or ankle to determine possible growth for your upper and lower body.
The following body measurements were used to be able to determine the values for all of Casey Butt's formulas.
5' 7.5"
Height
6.4"
Wrist
9.0"
Ankle
Are you a Hardgainer or Easygainer?


If regardless of effort put in, you are having a hard time to put on muscle, you are very likely a hardgainer. We can analyse how much (or not) of a hardgainer you are by looking at your skeletal structure - in this case wrist and ankle and comparing it to your height to identify if you meet the criteria.
Is it easier for you to add muscle on your Upper body or Lower body? The reason maybe your skeletal structure - so depending on how close or far away you are from the target may give you insights why you are having an easyier or harder time with part of your body.
8.75"
2.88%
2.88%
Ankle 12.96% of Height
Above target, you are NOT considered a hardgainer.
Above target, you are NOT considered a hardgainer.
7.05"
-9.27%
-9.27%
Wrist 10.45% of Height
Below target, you are considered a hardgainer.
Below target, you are considered a hardgainer.
Maximum Potential - Hardgainers
This model applies if you are considered a HARDGAINER, ie your Wrist and Ankle measurements are below the targets.
| Neck | 14.72" |
| 15.0" | ||||
| Chest Top | 43.02" |
| |||||
| Bicep Flexed | 14.59" |
| 15.0" | ||||
| Forearm Flexed | 11.71" |
| |||||
| Thigh Middle | 23.85" |
| |||||
| Calf | 16.2" |
|
Maximum Potential - Easygainers
This model applies if you are considered an EASYGAINER, ie your Wrist and Ankle measurements are above the targets.
| Neck | 15.65" |
| 15.0" | ||||
| Chest Top | 45.52" |
| |||||
| Bicep Flexed | 16.04" |
| 15.0" | ||||
| Forearm Flexed | 12.84" |
| |||||
| Thigh Middle | 24.66" |
| |||||
| Calf | 16.54" |
|
Steve Reeve Model
Compare yourself to symetric ideals of one of the most popular Body builders of our time.
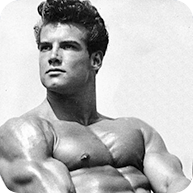
Steve Revees inspired thousands worldwide - first as an internationally titled bodybuilder, later as a proponent of Health and Fitness.
The physique of 1940s-1950s bodybuilding legend Steve Reeves will go down in history as being one of the most perfectly proportioned of all time. Many feel his body represents what a bodybuilding physique should look like - flawless and beautiful.
| Neck | 79% of Head | n/a |
| ||||
| Chest Top | 148% of Hip | n/a |
| ||||
| Bicep Flexed | 252% of Wrist | 16.13" |
| 15.0" | |||
| Waist | 86% of Hip | n/a |
| ||||
| Thigh Middle | 175% of Knee | n/a |
| ||||
| Calf | 192% of Ankle | 17.28" |
|
Greek Ideals
How do you compare to the Greek Ideals of the past?

Based on greek statues and ratios for the original Mr. Olympia. It considers your only measurement of Wrist to calculate your base Greek ratio, your ideal chest. All other comparisons and ratios are based of your calculated chest measurement.
In reality, the equations were based on 1950's and early 1960's Mr. America contestants and were written by a Canadian in 1964, with no reference to ancient Greece whatsoever. Ancient Greek sculpture body proportions were, in fact, much smaller everywhere but the waist. Also found in Stuart McRobert's books Brawn and Beyond Brawn.
All comparisons are based of the core Wrist to Chest Ratio by taking 650% of your wrist as the base line for your chest and comparing to all other body locations.
Core Ratios
| Chest Middle | 650% of Wrist | 41.6" |
| 37.2" | |||
| Neck | 37% of Ideal Chest | 15.39" |
| 15.0" | |||
| Waist | 70% of Ideal Chest | 29.12" |
| 35.7" | |||
| Hip | 85% of Ideal Chest | 35.36" |
| ||||
| Bicep Flexed | 36% of Ideal Chest | 14.98" |
| 15.0" | |||
| Forearm Flexed | 29% of Ideal Chest | 12.06" |
| ||||
| Thigh Middle | 53% of Ideal Chest | 22.05" |
| ||||
| Calf | 34% of Ideal Chest | 14.14" |
|
Your Chest Compared
As the formulas are based off an Ideal Chest Ratio, we want to also compare your other measurements to your current Chest measurement to give you a better idea of how close you are at the moment. To say it another way, we are REPLACING the Greek Ideal Chest ratio with your current chest ratio so you can get an idea of how close you are based on your current chest.
Using your own chest as a primary comparison is often a better comparison and provides you better comparisons.
37.2"
Chest Middle
| Neck | 37% of Chest Middle | 13.76" |
| 15.0" | |||
| Waist | 70% of Chest Middle | 26.04" |
| 35.7" | |||
| Hip | 85% of Chest Middle | 31.62" |
| ||||
| Bicep Flexed | 36% of Chest Middle | 13.39" |
| 15.0" | |||
| Forearm Flexed | 29% of Chest Middle | 10.79" |
| ||||
| Thigh Middle | 53% of Chest Middle | 19.72" |
| ||||
| Calf | 34% of Chest Middle | 12.65" |
|
Bicep Analysis
Take a deeper look into your Flexed Bicep to determine realistic progress.
Everyone loves Big Biceps - now what does it take to get there and how do I realistically analyse where I am today?
First we analyse your current Flexed bicep measures against the various model and of course normalizing your measure against your body fat values - lets face it fat is not muscle - this will give you an idea of how big your arms really are when comparing to your body fat levels.
The final aspect of your arm analysis is focused on understanding increase and decrease in your big ole' arms.
Understanding your Data
Comparing your bicep measurement at your body fat levels against the various Body Models based on Casey Butt, Greek Ideas and Steve Reeve
| Formula | Target | Body Fat 5.0 % | Body Fat 10.0 % | Body Fat 17.88 %(-7.88 %) | Body Fat 25.76 % | Body Fat 30.76 %(5.0 %) |
|---|---|---|---|---|---|---|
| Steve Reeve's Ratios | 16.13" | 15.63" | *16.13" | 16.92" | 17.7" | 18.2" |
| Casey Butt - Max Potential | 16.04" | 15.54" | *16.04" | 16.83" | 17.62" | 18.12" |
| Greek Ideals | 14.98" | 14.48" | *14.98" | 15.76" | 16.55" | 17.05" |
| Casey Butt - Hardgainer Potential | 14.59" | 14.09" | *14.59" | 15.38" | 16.17" | 16.67" |
| Your Results | 15.0" | 12.92" | 13.42" | 14.21" | 15.0" | 15.5" |
Better Understanding Progress - Volume Analysis
Improving your Flexed Bicep size comes with quite a few challenges that have to be understood to be realistic about progress.
Natural Limits & Progress: As you are increasing the size of your bicep, you are at the same time also getting closer to natural limits - this will slow down progress as you are trying to increase.
Circumference vs Area: The next is understanding the increase in circumference and area that is being occupied. For example, when you add 1" to your 15" arms, you are adding 6.67% in circumference, however, the area required to increase is 13.78% - quite a bit more. As you are adding additional inches to your arm, the area increase will be larger in comparison - so getting bigger arms will become more and more difficult.
In order to better understand this challenge you can use the visual arm progress chart below. Yes we know it maybe a bit hard to read (a tad over engineered again) but it better visualizes how much you truely have to gain to reach certain limits.